
I Thought Logging Was One Line Until I Saw the Cost of Serialization Through Buffer Pooling
Concurrent writes corrupt logs. Mutex bottlenecks serialize work. Buffer pooling reveals what serialization actually costs

What Logging Actually Costs
I used to think logging was this:
log.Info("request ended")One line. Done.
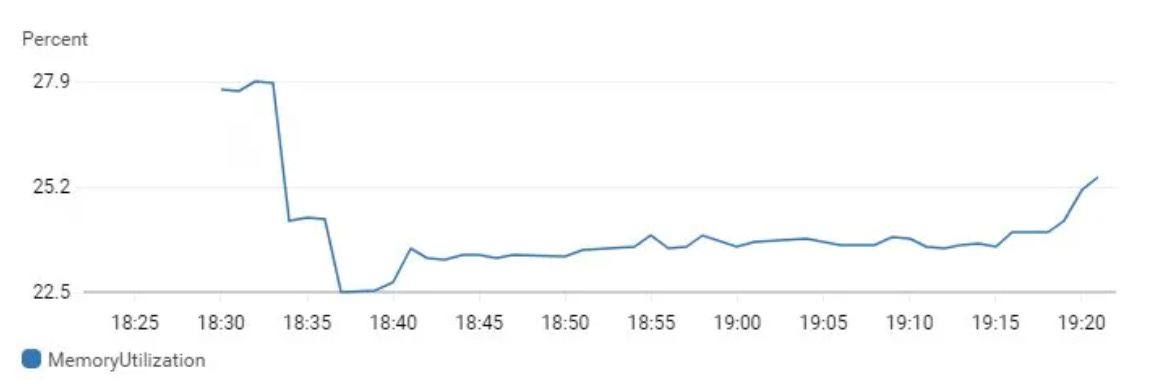
Turns out logging under high concurrency is where I finally understood what serialization actually costs. I’d seen memory spikes in CloudWatch before when traffic spiked 1,000+ requests/min on a single EC2 instance, memory usage climbing. Understanding how logging works under concurrency made allocation pressure visible.
What a log write actually is
When you call:
log.Info(ctx, "Request ended", "duration", "8.2s", "status", 200)Three things happen.
Formatting. Individual fields get assembled into a byte sequence:
"duration" + "8.2s" + "status" + 200
        ↓
{"time":"...","level":"INFO","msg":"Request ended","duration":"8.2s","status":200}
This assembled byte sequence lives in a scratch buffer in memory while being built.
Write. The formatted bytes get written to fd=1 (stdout):
w.Write(buf) // syscall → kernel → fd=1 → wherever stdout pointsDiscard. The scratch buffer is done, goes out of scope.
Simple enough for one goroutine. Now add 1000 concurrent request handlers all logging simultaneously.
The concurrent write problem
Two goroutines writing to fd=1 simultaneously without coordination:
goroutine A: {"level":"INFO","msg":"Request en
goroutine B: {"level":"ERROR","msg":"upload failed"}
goroutine A: ded","duration":"8.2s"}
What lands on disk:
{"level":"INFO","msg":"Request en{"level":"ERROR","msg":"upload failed"}ded","duration":"8.2s"}Not valid JSON. Log parsers break. Loki can’t index fields. Grafana shows garbage. A real production incident becomes unreadable at the worst possible moment.
The fix is a mutex around the write.
slog‘s JSONHandler does exactly this:
type JSONHandler struct {
    mu *sync.Mutex
    w  io.Writer
}

func (h *JSONHandler) Handle(ctx context.Context, r Record) error {
    h.mu.Lock()
    defer h.mu.Unlock()
    // format entire record into internal buffer
    // write complete JSON line to w
}
One goroutine holds the mutex, formats and writes, releases. Others wait. Each log line lands as a complete JSON object, no interleaving.
The mutex bottleneck
The mutex solves correctness. But it covers the entire format+write operation:
[goroutine A holds mutex: building JSON string... writing... done]
[goroutine B waits                                               ]
[goroutine C waits                                               ]
Under 1000 concurrent goroutines, 999 are waiting while 1 formats. The expensive part, assembling the JSON string, is serialized even though it could be done in parallel. Each goroutine is working with its own data, there’s no reason they can’t format simultaneously.
The insight: formatting doesn’t need shared state. Only the write to fd=1 needs coordination.
slog:    [mutex: format + write]          ← mutex too wide
zerolog: format (no mutex) → [mutex: write only]  ← mutex as narrow as possible
zerolog’s approach, format outside the lock
zerolog moves formatting outside the mutex by giving each goroutine its own scratch buffer to format into:
// goroutine A                    // goroutine B
buf_A := pool.Get()               buf_B := pool.Get()
buf_A.Write(`{"level":"INFO"...`) buf_B.Write(`{"level":"ERROR"...`)
// both formatting in parallel, no contention

mutex.Lock()                      // B waits here
w.Write(buf_A)
mutex.Unlock()
                                  mutex.Lock()
                                  w.Write(buf_B)
                                  mutex.Unlock()
Formatting happens in parallel. The mutex window shrinks to just the write syscall, microseconds instead of milliseconds.
But where do the scratch buffers come from?
The naive approach: allocate a fresh []byte for every log call. Under 1000 requests/sec, that’s 1000 allocations/sec just for log buffers, continuous GC pressure. This is where sync.Pool comes in.
sync.Pool: object pooling for scratch buffers
sync.Pool is a pool of reusable objects. Instead of allocating and discarding:
allocate → use → discard → GC collects → allocate → use → discard → GC collects ...You reuse:
allocate once → use → reset → return to pool → use → reset → return to pool ...Basic usage:
var pool = &sync.Pool{
    New: func() any {
        return bytes.NewBuffer(make([]byte, 0, 1024))
    },
}

buf := pool.Get().(*bytes.Buffer)   // checkout: reuse existing or allocate new
buf.WriteString(`{"level":"INFO"}`) // format into it
// ...write to fd=1...
buf.Reset()                          // clear contents, keep underlying memory
pool.Put(buf)                        // checkin: available for next caller
The key: buf.Reset() clears the contents but keeps the allocated []byte underneath. The memory is reused, not garbage collected and reallocated.
A catch: buffer sizes vary. One log message might need 500 bytes, another 5KB. But bytes.Buffer grows dynamically, and keeps that capacity after Reset():
buf := pool.Get().(*bytes.Buffer)  // capacity: 1024 (initial)
buf.WriteString(veryLongJSON)      // content: 8KB → buffer grows to 8KB capacity
buf.Reset()                        // content cleared, capacity: still 8KB
pool.Put(buf)                      // 8KB-capacity buffer goes back to pool
Reset() zeroes the length but doesn’t touch the underlying []byte array. The slice capacity stays. So the pool naturally holds buffers at the high-watermark of what’s been written through them.
After a warm-up period, pool buffers converge to the size of typical log lines, not the initial 1024 you allocated in New. Each buffer has organically grown to fit real usage. Occasional large entries cause a one-time growth, then that larger buffer circulates.
The trade-off: an unusually large log line (say, a 500KB debug dump) causes one buffer to grow to 500KB. That buffer now lives in the pool permanently, until GC collects it via the victim cycle. You’re holding 500KB of RAM for a buffer that 99% of requests will use 2KB of.
But you’re still orders of magnitude better than allocating fresh on every call. Pooling doesn’t assume uniform buffer sizes. It assumes that buffers, once grown to fit real usage, will keep fitting real usage. The growth cost is paid once. The reuse benefit is paid on every subsequent call.
This is what allocation pressure looks like. Concurrent request handlers each allocating scratch buffers. Without pooling, every goroutine allocates fresh. Under high traffic, those allocations pile up faster than GC can collect them. Memory climbs. The spike isn’t a leak. It’s just allocation pressure under concurrency.
This is what sync.Pool prevents.
Why sync.Pool is lock-free in the common case
A naive pool would use a mutex-protected slice. Under high concurrency, goroutines would contend on that mutex, no better than what we started with.
sync.Pool is smarter. It exploits Go’s scheduler structure.
Go’s scheduler has P processors (one per CPU core by default). Every goroutine runs on a P. sync.Pool gives each P its own local slot:
Pool
  local[0] → buf   ← P0's slot
  local[1] → buf   ← P1's slot
  local[2] → nil   ← P2's slot, empty
  local[3] → buf   ← P3's slot
When a goroutine calls pool.Get():
Which P am I on? Say P0.
Is
local[0]non-nil? Yes → take it. Done. No lock needed.If nil → check other P’s slots (needs lock) → if all empty → call
New
The common case (P has an object in its slot) is lock-free. Only the uncommon case (P’s slot is empty, need to steal from another P) requires a lock.
The goroutine stays on P0 the entire time. When P0’s slot is empty, the goroutine (still on P0) reaches across and takes an object from another P’s slot. The object moves, the goroutine doesn’t.
This is called work stealing, the same pattern the Go scheduler uses, but here we’re stealing objects, not goroutines.
The GC interaction: victim cache
Here’s where it gets interesting.
sync.Pool is not a cache. Objects in the pool can disappear at any GC cycle. But there’s a grace period.
When GC runs, sync.Pool doesn’t immediately drop everything. It moves the current pool contents into a victim cache, a secondary holding area. The victim cache survives for exactly one more GC cycle.
GC #1: current pool → victim cache
       pool is now empty

During the next GC interval:
  - Get() checks current pool first
  - If empty, checks victim cache
  - If both empty, calls New()

GC #2: victim cache is cleared
       (objects from GC #1 are finally eligible for collection)
Why does this matter?
After a traffic spike, allocation rate drops. GC runs. Without the victim cache, the pool would be empty immediately, and the next request would allocate fresh buffers even though the spike just ended.
The victim cache gives the system two GC cycles to smooth the transition. If traffic stays low, objects eventually get collected. If traffic spikes again before the second GC, the victim cache prevents re-allocation.
The pattern appears everywhere
Once I understood why sync.Pool exists for logging, I started seeing it everywhere.
HTTP request/response body buffers
When Go’s net/http receives a request, it reads raw TCP bytes into a buffer before parsing headers, body, etc. Thousands of concurrent connections = thousands of concurrent buffer allocations without pooling. Go’s HTTP server uses sync.Pool internally for exactly this.
TCP socket → pool buffer → HTTP parser → request struct
                ↑ pooled
JSON encode/decode scratch buffers
json.Marshal builds a []byte while encoding your struct to JSON. json.Unmarshal needs scratch space for tokenizing the input. Both operations are short-lived and happen on every API request.
Go struct → scratch buffer (JSON bytes being built) → write to TCP socket
                ↑ pooled
The buffer contains the in-progress JSON string, exists only for the duration of the marshal call, then done. Libraries like jsoniter and easyjson use pools aggressively for this reason.
Database query result buffers
The database driver reads raw bytes from the TCP connection (the database protocol wire format) into a scratch buffer, then deserializes into your Go structs. The buffer is the temporary home for raw wire data between “arrived from network” and “parsed into application types.”
TCP bytes (DB wire protocol) → pool buffer → deserializer → your Go struct
                                    ↑ pooled
Under concurrent queries, each goroutine needs its own buffer, pool provides them without per-query allocation cost.
Protobuf marshalling buffers
Same as JSON, protobuf encoding builds a byte sequence before writing to the network. protoc-generated Go code uses pools internally for the scratch buffer.
The general pattern
Any time you see:
A scratch buffer allocated at the start of an operation
Used temporarily to hold intermediate bytes
Discarded when the operation completes
Under concurrent load
That’s a candidate for sync.Pool.
The smell in code: make([]byte, ...) or new(SomeStruct) inside a hot path that runs thousands of times per second.
Object pooling vs connection pooling
Connection pooling reuses TCP connections instead of creating new ones per request. Creating a TCP connection is expensive: 3-way handshake, TLS negotiation, kernel buffer allocation.
Buffer/object pooling reuses memory allocations instead of allocating per operation. Creating a buffer is cheap individually but expensive at scale: GC pressure, allocation spikes, increased latency variance.
Same underlying idea: expensive-to-create resource, reuse instead of recreate. Different resources, same pattern.
                    Connection Pool              Buffer Pool
─────────────────────────────────────────────────────────────────────
Resource            TCP connection               Memory allocation
Expense avoided     Handshake + kernel setup     GC pressure + allocation
Go primitive        http.Transport               sync.Pool
Lifecycle           Long-lived                   Ephemeral (reset per use)
Pool size           Bounded (MaxIdleConns)       Unbounded, GC-managed
The hidden cost of serialization
Understanding buffer pooling leads to a bigger realization: serialization is not free, and we introduce it constantly without thinking about it.
Every log write serializes fields into JSON bytes. We studied this carefully, scratch buffers, GC pressure, mutex contention. But the exact same cost exists at every API boundary in a system:
Service A
    ↓
marshal to JSON/protobuf
(scratch buffer, GC pressure, CPU cycles building bytes)
    ↓
network
    ↓
unmarshal
(scratch buffer, GC pressure, CPU cycles parsing bytes)
    ↓
Service B
Every microservice call pays this twice. Every database query pays it. Every cache read pays it. Every message queue publish/consume pays it.
What serialization actually costs
At the code level it looks like one line:
json.Marshal(myStruct)What’s actually happening:
Allocate a scratch buffer
Reflect over every field of the struct
Convert each field to its string/byte representation
Write delimiters, quotes, brackets
Return the completed byte sequence
GC eventually collects the scratch buffer
And then on the receiving end, unmarshal does the reverse, tokenize the bytes, allocate new struct fields, parse each value back into its Go type.
Under high concurrency, this is happening thousands of times per second across every service boundary.
The invisible tax of microservices
In a monolith, a function call has zero serialization cost:
result := orderService.GetOrder(id) // in-process, just a pointerSplit that into two services:
Client
    ↓
marshal request
    ↓
HTTP
    ↓
unmarshal request
    ↓
[Service processes]
    ↓
marshal response
    ↓
HTTP
    ↓
unmarshal response
    ↓
Client receives result
Four serialization operations for what was zero. Every service boundary you add multiplies this cost across every request that crosses it.
Teams have measured 30-40% of total request latency in some microservice architectures being pure serialization overhead, not business logic, not database queries, not network RTT. Just converting data between bytes and structs.
Why we don’t notice
Frameworks hide it. gin.ShouldBindJSON(&req) looks like one line. gRPC stubs look like function calls. The cost is real but invisible until you profile under load and see serialization dominating your flame graph.
The design implication
Every time you say “let’s add an API” or “let’s split this service,” you’re adding a serialization boundary. That’s sometimes the right call, isolation, independent deployments, team ownership. But it’s a cost, not just an architectural choice.
Questions worth asking before adding an API boundary:
Can this be an in-process call instead?
If it must be remote, can we use a binary format (protobuf) instead of JSON?
Can we batch calls to amortize the serialization cost?
Is the data structure designed to serialize efficiently (flat vs deeply nested)?
Protobuf vs JSON: not just syntax
This is why protobuf exists. JSON serialization uses reflection and string manipulation. Protobuf uses generated code with direct field access no reflection, smaller wire format, faster parse. The trade-off: schema must be defined upfront, less human-readable.
At high volume, this matters:
JSON:     ~500ns to marshal a typical request struct
Protobuf: ~100ns for the same struct
5x difference. Across millions of requests per day, that’s real CPU time.
The logging connection
This is what made logging non-trivial: it’s serialization on every request, under concurrency, in the hot path. The solutions, zerolog, sync.Pool, narrow mutexes, are the same solutions high-performance serialization libraries use everywhere.
Logging just made the problem visible because it happens on every single request, not just at service boundaries.
What I learned
A log write is format + write. Format is parallelizable, write must be serialized. Putting both under the same mutex is the conservative but suboptimal choice.
sync.Pool is for ephemeral scratch space. Short-lived, frequently allocated, cheap to reset. Not for objects with meaningful state.
Pool size is dynamic. Grows under spikes, shrinks after two GC cycles. No manual sizing.
Per-P slots make Get/Put lock-free in the common case. The GC interaction (victim cache) gives a two-cycle grace period to smooth post-GC allocation spikes.
Buffer pooling and connection pooling are the same idea. Reuse expensive-to-create resources instead of creating them fresh per operation.
The pattern appears everywhere in high-performance Go. net/http, encoding/json, database drivers, protobuf all use pooling internally.
Serialization is not free, and we introduce it constantly. Every API boundary pays serialization cost twice (marshal + unmarshal). Every microservice split multiplies this across every request that crosses the boundary. In-process function calls have zero serialization cost.
“Let’s add an API” is a serialization decision. Before adding a service boundary, ask: can this be in-process? If remote is necessary, use binary formats (protobuf) over text (JSON), batch calls, and design flat data structures. 30-40% of request latency in some microservice architectures is pure serialization overhead, not business logic, not network RTT.
Logging made serialization visible because it’s on every single request. The solutions (zerolog, sync.Pool, narrow mutexes) are the same patterns high-performance serialization libraries use everywhere. Logging is just the place where the cost became impossible to ignore.